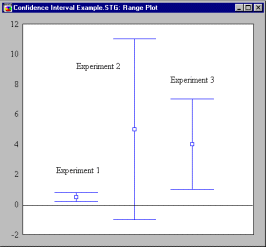
Today I had the pleasure to discuss with my respected colleague Mirweis the issue in the title. Mirweis, who can be defined a picky statistician, highlighted the fact that often the outcome of a significance test is used to describe the “strenght” of an experimental result. However, the p-value is a measure of probability that repeating the measure we would obtain the same results. Comparing two p-values might be misleading. Using confidence intervals is a better solution.
Inadequacies of the Hypothesis Testing Approach. Strictly speaking, the outcome of a significance test is the dichotomous decision whether or not to reject the null hypothesis. This dichotomy is inherently dissatisfying to many scientists who use the null hypothesis as a statement of no effect, and are more interested in knowing how big an effect is than whether it is (precisely) zero. This has led to behavior like putting one, two, or three asterisks next to results in tables, or listing p levels next to results, when, in fact, such numbers, across (or sometimes even within!) studies need not be monotonically related to the best estimates of strength of experimental effects, and hence can be extremely misleading. Some writers (e.g., Guttman, 1977) view asterisk-placing behavior as inconsistent with the foundations of significance testing logic.
Probability levels can deceive about the “strength” of a result, especially when presented without supporting information. For example, if, in an ANOVA table, one effect had a p level of .019, and the other a p level of .048, it might be an error to conclude that the statistical evidence supported the view that the first effect was stronger than the second. A meaningful interpretation would require additional information. To see why, suppose someone reports a p level of .001. This could be representative of a trivial population effect combined with a huge sample size, or a powerful population effect combined with a moderate sample size, or a huge population effect with a small sample. Similarly a p level of .075 could represent a powerful effect operating with a small sample, or a tiny effect with a huge sample. Clearly then, we need to be careful when comparing p levels.
In Accept-Support testing, which occurs frequently in the context of model fitting in factor analysis or “causal modeling,” significance testing logic is basically inappropriate. Rejection of an “almost true” null hypothesis in such situations frequently has been followed by vague statements that the rejection shouldn’t be taken too seriously. Failure to reject a null hypothesis usually results in a demand by a vigilant journal editor for cumbersome power calculations. Such problems can be avoided to some extent by using confidence intervals.

More here (click on “What is “statistical significance” (p-value).” and then to “Power Analysis”).
Copyright notice: the present content was taken from the following URL, the copyrights are reserved by the respective author/s.
