Inadequacies of the Hypothesis Testing Approach

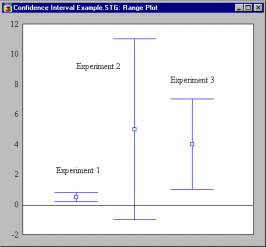
Today I had the pleasure to discuss with my respected colleague Mirweis the issue in the title. Mirweis, who can be defined a picky statistician, highlighted the fact that often the outcome of a significance test is used to describe the “strenght” of an experimental result. However, the p-value is a measure of probability that repeating the measure we would obtain the same results. Comparing two p-values might be misleading. Using confidence intervals is a better solution.

Inadequacies of the Hypothesis Testing Approach. Strictly speaking, the outcome of a significance test is the dichotomous decision whether or not to reject the null hypothesis. This dichotomy is inherently dissatisfying to many scientists who use the null hypothesis as a statement of no effect, and are more interested in knowing how big an effect is than whether it is (precisely) zero. This has led to behavior like putting one, two, or three asterisks next to results in tables, or listing p levels next to results, when, in fact, such numbers, across (or sometimes even within!) studies need not be monotonically related to the best estimates of strength of experimental effects, and hence can be extremely misleading. Some writers (e.g., Guttman, 1977) view asterisk-placing behavior as inconsistent with the foundations of significance testing logic.

Probability levels can deceive about the “strength” of a result, especially when presented without supporting information. For example, if, in an ANOVA table, one effect had a p level of .019, and the other a p level of .048, it might be an error to conclude that the statistical evidence supported the view that the first effect was stronger than the second. A meaningful interpretation would require additional information. To see why, suppose someone reports a p level of .001. This could be representative of a trivial population effect combined with a huge sample size, or a powerful population effect combined with a moderate sample size, or a huge population effect with a small sample. Similarly a p level of .075 could represent a powerful effect operating with a small sample, or a tiny effect with a huge sample. Clearly then, we need to be careful when comparing p levels.

In Accept-Support testing, which occurs frequently in the context of model fitting in factor analysis or “causal modeling,” significance testing logic is basically inappropriate. Rejection of an “almost true” null hypothesis in such situations frequently has been followed by vague statements that the rejection shouldn’t be taken too seriously. Failure to reject a null hypothesis usually results in a demand by a vigilant journal editor for cumbersome power calculations. Such problems can be avoided to some extent by using confidence intervals.
Popup196

More here (click on “What is “statistical significance” (p-value).” and then to “Power Analysis”).

Copyright notice: the present content was taken from the following URL, the copyrights are reserved by the respective author/s.

effetti della ‘legge grillo’

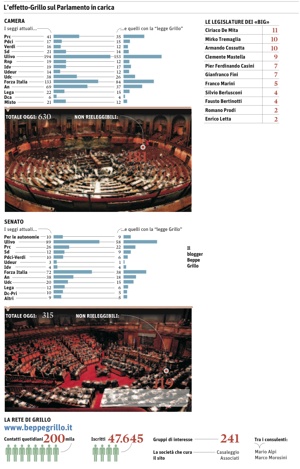
Il Sole 24 ore ha pubblicato un articolo che riassume gli effetti di una simulazione nella quale la legge di iniziativa popolare promossa da Beppe Grillo viene applicata all’attuale parlamento. I risultati sono devastanti: a perdere il seggio sarebbero 300 eletti, tra cui i ‘big’ della politica.

Tutti i partiti verrebbero sostanzialmente purificati delle ‘cariatidi’ che affossano la democrazia del nostro paese. Sarebbe una vera liberazione. E’ per questo che l’attuale parlamento non voterà mai una tale legge. Sarebbe puro suicidio politico.

Io ho firmato per l’iniziativa e trovo offensive le parole del dipendente Pier Ferdinando Casini (Udc): «Solo una classe politica senza ideali e priva di serie motivazioni può scodinzolare dietro Beppe Grillo». Caro dipendente Casini, le comunico che io ho più ideali di lei ed ho serie motivazioni che mi portano a ritenere che tutti i politici come lei dovrebbero fare altro invece di legiferare. Mi rendo conto, per contro, del perché lei reagisca così vigorosamente all’iniziativa, essendo la sua poltrona e molte del suo partito a rischio. La verità è che non abbiamo bisogno di lei e di quelli come lei.

W la democrazia diretta!!!

Effetti Legge Grillo-1

Do People Understand Spatial Concepts: The Case of First-Order Primitives

Golledge, R. G. Theories and Methods of Spatio-Temporal Reasoning in Geographical Space, vol. 639 of Lecture Notes in Computer Science. Springer-Verlag, Heidelberg, Germany, 1992, ch. Do People Understand Spatial Concepts: The Case of First-Order Primitives, pp. 3–21. [pdf]

———

The author hypothetize in this paper that most individuals develop only a “common sense” configurational understanding of spatial phenomena, which accounts for incomplete and fuzzy cognitive representations of environments, and partly accounts for many spatially irrational behaviors. The author explain how human possess different degrees of spatial abilities like the ability to think geometrically, the ability to image complex spatial relations, the ability to recognize spatial patterns, etc, all of which are task dependent. Reading a map requires skills in symbol identification and orientation.

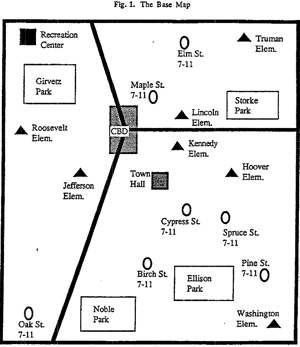
The paper reports an experiment where the author wished to find out if people become aware of functional distributions (e.g., shops, schools) and their spatial properties when asked to learn about an environment.

Results shows that even simple first order geographic primitives such as the idea of pair proximity or nearest neighbor, is not necessarily well understood in the complex map situation tested. More in details, the two distributions were not regarded as being similar, and that even performing common tasks on each distribution produced significant differtent results. No difference even between geographers and non-geographers.

One reason for a lack of good performance on the cue location reproduction task for example might be that people regionalized the initial map and that this interfered with their ability to comprehend the functional distribution as a single entry.

Golledge Map-Reading

the way to pilgrimage

…it is not surprising that the “Way to Santiago” has been sometimes considered as an example of the Church’s pilgrimage on its journey towards the heavenly city. It is a path of prayer and penance, of charity and solidarity; a stretch of the path of life where the faith, becoming history among mankind, also converts culture into something Christian. The churches and abbeys, the hospitals and shelters of the Way to Santiago still speak of the Christian adventure of making pilgrimage in which the faith becomes life, history, culture, charity and works of mercy.

John Paul II, Pastoral Journey to Santiago de Compostela and Asturias on the occasion of Fourth World Youth Day, 1989.

Grounding spatial language in perception: An empirical and computational investigation

Regier, T., and Carlson, L. A. Grounding spatial language in perception: An empirical and computational investigation. Journal of Experimental Psychology: General 130, 2 (2001), 273–298. [pdf]

——–

This paper presents an empirical validation of the attention vector sum model (AVS), which predict zone of acceptability for spatial expressions confronted to perceptual stimuli. Their research question was the following: What perceptual or cognitive structures are reflected in linguistic judgments? Does spatial perception shape spatial languagein this instance?

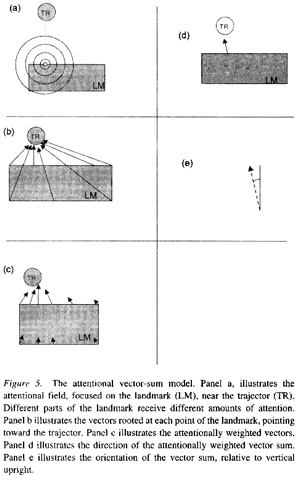
The author presented a number of computational models developed in previous research as well as the AVS: The Bounding Box model, the Proximal and Center of Mass model, The Hybrid Model. AVS is based on the fact that human apprehension of spatial relations involves attention, and that in several neural subsystems, overall direction is represented as the vector sum od a set of a constituent directions.

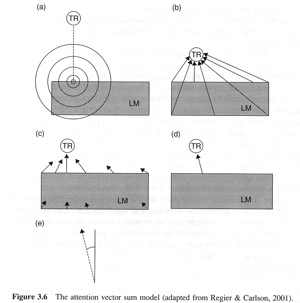
In the model, an attentional beam is focused on the landmark. In particular, the beam is focused on that point of the landmark top that is vertically aligned with the trajector or closest to being so aligned. Parts of the landmarks near the center of this beam are strongly attended, whereas more distant parts of the landmark receive less attention. This yields a distribution of attention across the landmark object. The attentional beam radiates out to illuminate different parts of the landmark at different strenghts, depending on the distance from the focus.

The authors tested empirically the accuracy of predictions of the different models by presenting the model with the experimental stimuli, recording the model’s output, and determining through the regression how well the model output predicted the empirically obtained acceptability rating.

The study confirmed the predictions of the AVS model: first, spatial terms ratings are influenced by the proximal and center-of-mass orientations. Second, ratings are sensitive to the grazing line (the horizontal line grazing the very top of the landmark). Third, ratings are affected by distance. The model provides a preliminary grounding of linguistic spatial categories in nonlinguistic perception: linguistic spatial categories can be explained in terms of underlying structures that are not linguistic in character.

Regier Avs

Grounding language in perception: from “saying” to “saying and acting”

Coventry, K. R., and Garrod, S. C. Saying, Seeing and Acting: the Psychological Semantics of Spatial Prepositions. Psychology Press, East Sussex, Great Britain, 2004, ch. Grounding language in perception: from “saying” to “saying and acting”, pp. 37–70.

———

This chapter opens with the argument that it is extremely difficult to pin down what expressions like “higher than” mean because natural language only encode a limited number of spatial relations between objects and these have to cover the whole range of possibilities. The authors propose a ‘functional geometric framework’ that enables to better comprehend spatial prepositions because it involves both geometric constraints and extra-geometric constraints.

The chapter first reviews the major contributions to the modelization of geometry of spatial relations. Cohn et al. (1996) developed a qualitative geometry of space called the region connection calcolus. Ullman (1996) argued that perceptual processing requires visual routines different from the basic process of basic vision. Visual routines serve functional perception. They are optimal and subject to attention control.

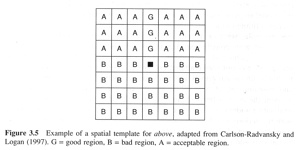
Logan and Sadler (1996) claim that spatial templates underlie the apprehension of spatial relations and spatial prepositions. A template is a representation that is centered on the reference object and aligned with the reference frame imposed on the reference object.

Coventry Template

Regier and Carlson (2001) developed the attention vector sum model, a computational model to compute the relations captured by the spatial template theory. AVS takes into account the tole of attention in determining a spatial relation and has much the same character as one of Ullman’s visual routines. The model works by focusing an attentional beam on the reference object at the point that is vertically aligned with the closest part of the located object. Parts of the reference object nearest to the located object are masimally attended and more distant parts are attended less.

Coventry Avs

Finally the authors stress out the importance of including extra-geometric relation in order to ammeillorate the AVS framework. The spatial prepositions refer to the position of objects in space but also to tha content of a spatial preposition contributes to the meaning of an expression (the contained object moves toward the container).

The functional geometric framework aims to capture the representation of spatial relations not just in terms of how viewers see such relations, but also in terms of how they act on the world they see, and in terms of how objects meaningfully interact in that world. In synthesis the authors argues that what objects are fundamentally influences how one talks about where they are located.

[More]

Human performance on visually presented travelling salesperson problems with varying numbers of nodes

Dry, M., Lee, M. D., Vickers, D., and Hughes, P. Human performance on visually presented travelling salesperson problems with varying numbers of nodes. The Journal of Problem Solving 1, 1 (2006), 20–32. [pdf]

————

This article shows that despite the apparent intractability of the TSP (Traveling Salesman Problem), research into human performance upon visually presented TSPs has indicated that participants are capable of solving the problems to nes optimal accuracy with minimum cognitive effort.

Participants appear to spend a roughly contant time per node, implying the the total time required to arrive to a solution is a linear function of the number of nodes. Second, there are many algorythms that yield approximate solutions to TSP instances. However, no known algorithm predicts a simple linear relationship between solution time and number of nodes.

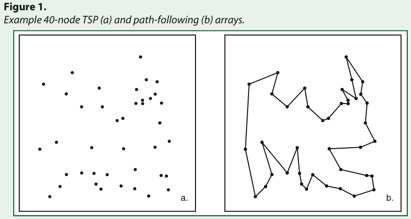
The authors presented random problems to participants. A white stimuly with black dots. The goal was to join the dots in such a way that the path was closed and that the path lenght was minimal.

Using an optimal solution as benchmark, it was possible to measure the mean participant deviation from optimality for each problem in the TSP condition. Participants solution lenght closely approximate the estimated optimal solution lenghts, with deviation asymptoting around 0.11.

Author discuss that perception of the convex hull (a boundary so that no line joining any two nodes in the array can fall outside it) is a form of figure-ground segregation. They also argue that we need to take a distinction between the spontaneous parallel processes involved in the initial perception of the structure in TSP arrays and the serial processes of linking individual nodes or clusters of nodes.

Dry Tsp Experiment

building instructions and user mistakes

Yesterday, I had a nice discussion with Mark on how to build effective building instructions. I am a great fan of LEGO bricks and I am used to read their building instructions that represents the model in a three-dimensional perspective and show at each step the parts that need to be included.

Mark was highlighting that instructions should prevent user’s mistakes before they arise. Many times it happened to me that a wrong interpretation of the drawing brought me to a mistakes that had consequences and was detected only a couple of steps afterwards. Then the way to fix is to go back those steps and try again. However, this is something possible with LEGO bricks. When the building parts are made of wood and iron then a mistake can have permanent consequences. In these cases, preventing a mistake is even more important.

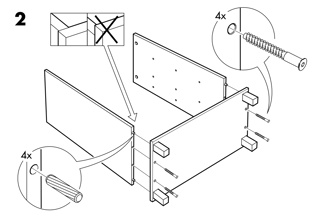
IKEA does a great work in designing readable building instructions for their furniture elements. I remember spotting many times details added to prevent mistakes. In the example below, the user is cautioned to align the two parts in such a way that the right hole is filled with the metallic screw.

Ikea Instruction-Mistakes

More examples here.