Building a map visualization of statistical markers

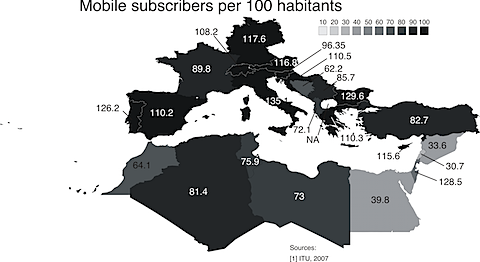
This week end, I was playing with a map visualization. I wanted to show the difference between the penetration of internet and mobile phones for the Mediterranean area. The easiest way to do it is to use a vector-based drawing of Europe. In my case, I started from a free shapefile of the world (ESRI standard for Geographical Information Systems). Then, I used uDIG, an open source GIS, for removing all the unwanted countries. The next step required the conversion of the ShapeFile into a vector drawing. To this end, I used ScapeToad, transforming the GIS file into a Scalable Vector Graphic (.svg). This format can be imported in most vector-based drawing program. I used CorelDraw. In the drawing, I created a color gradient with 10 different levels. I used a gray-scale palette as I felt that was simple enough for communicating the differences between the countries.

The second element that is required to build these visualizations is a good source of data. For this exercise, I used the Internet Usage World Stats, edited by the Miniwatts Marketing Group. The second source is the International Telecommunication Union, ITU.

The result can be seen in the two pictures below. While for Internet penetration we can see a huge difference between Northern Africa and Europe, the same difference is not visible in the number of mobile subscribers. In other words, while Northern African countries are still catching up to provide electricity and internet access to their populations, Cellular technology is almost available to every citizen. These two visualizations are going to be presented in the Global Information Society meeting, held in Marseille, France, next week.
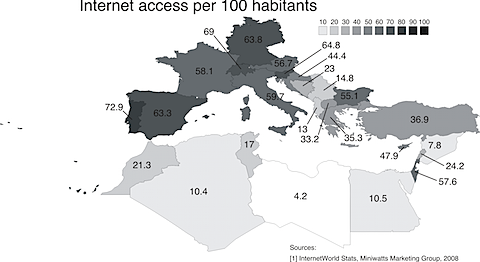
internet_per_100habitants.png

cell-phones_per_100habitants.png

Natural environment

“When anyone says the word ‘nature’, we should ask the question, ‘Which nature?’ Naturally fertilized cabbage? Nature as it is, industrially lacerated? Country life during the 1950s (as it is represented in retrospect today, or as it was represented in days gone by to country folk, or to those who dreamed of country life)? Mountain solitude before the publication of hikers’ guides to deserted valleys? Nature as conceived by natural science? Nature without chemicals? The polished ecological models of interconnectedness? Nature as it is depicted in gardening manuals? Such nature as one years for (peace, a mountain stream, profound contemplation)? As it is praised and priced in the supermarkets of world solitude? Nature as a sight for sore eyes? The beauty of a Tuscan landscape — in other words, a highly cultivated art of nature? Or nature in the wild? The volcano before it erupts? The nature of early cultures, invested with demonic power, subjectivity and the living gods of religion? The primeval forest? Nature conceived as a zoo without cages? As it roars and rages in the cigarette advertisements of the city’s cinemas?”

–Ulrich Beck, “Ecological Politics in an Age of Risk

Mobile essentials: field study and concepting

Chipchase, J., Persson, P., Piippo, P., Aarras, M., and Yamamoto, T. (2005). Mobile essentials: field study and concepting. In DUX ’05: Proceedings of the 2005 conference on Designing for User eXperience, page 57, New York, NY, USA. AIGA: American Institute of Graphic Arts. [PDF]

————

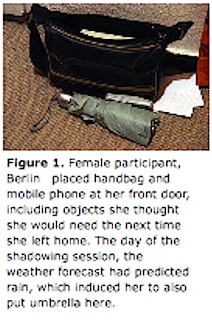
This paper dscribe a field study of Mobile essentials, which the authors define as the objects most people consider essisntial and carry most of the time whilst out and about. They conducted ‘shadowing’ observations in four different cities in different countries. The research team spent one day with each of the 17 subjects. First they followed the individual during 3-6 hours then withdrew for a couple of hours to adapt predefined questions, and finally interviewed the participant.

They found that three objects can be considered essentials irrespective of culture or genger: keys, cashm and phone. Then they identified nine categories of peripheral MEs: travel support, identification, medical, addition, emotional & spiritual, appearence, entertainement, contact & other information, and payment.

They also identified a number of general strategies people adopt to support carrying: containment, for instance, reduces the mental and physical workload of bringing and remembering multiple MEs. Also connectors cluster small-scale objects (e.g., keychains).

They observed a number of interesting phenomena, like the distance and position of ME objects in relation to the user, defined as range of distribution. E.g., in public transport MEs are kept within line of sight. They also found that MEs are usually forgot because they are not left in the immediate line of sight during the transition phase (e.g., leaving home for work). The primary strategy that people use to stay alert during a transition phase is called the point of reflection, involving the user pausing other activities in order to be able to reflect on what to bring.

Chipchase_MobileEssentials.jpg

Mode preference in a simple data-retrieval task

A. I. Rudnicky. Mode preference in a simple data-retrieval task. In HLT ’93: Proceedings of the workshop on Human Language Technology, pages 364–369, Morristown, NJ, USA, 1993. Association for Computational Linguistics. [PDF]

———–

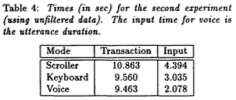
The study reported in this paper indicates that users show a preference for speech input despite its inadequacies in terms of classic measures of performance, such as time-to-completion. Subjects in this study based their choice of mode on attributes other than transaction time (quite possibly input time) and were willing to use speech input even if this meant spending a longer time on the task. This preference appears to persist and even increase with continuing use, suggesting that preference for speech cannot be attributed to short-term novelty effects.

This paper also sketches an analysis technique based on FSM (Finite State Machine) representations of human-computer interaction that permits rapid automatic processing of long event streams. The statistical properties of these event streams (as characterized by Markov chains) may provide insight into the types of information that users themselves compute in the course of developing satisfactory interaction strategies.

Rudnicky_input-time.jpg

Time as essence for photo browsing through personal digital libraries

A. Graham, H. Garcia-Molina, A. Paepcke, and T. Winograd. Time as essence for photo browsing through personal digital libraries. In JCDL ’02: Proceedings of the 2nd ACM/IEEE-CS joint conference on Digital libraries, pages 326–335, New York, NY, USA, 2002. ACM. [PDF]

———-

This paper decribes PhotoBrowser, a prototype system for personal digital pictures that organize the content using the timestamps of each photo. The authors’ main assumption is that text annotations are great because are accessible to a variety of search and processing algorithms. Many systems exploits this possibility requiring time-intensive manual annotations (e.g., FotoFile [Kang and Shneiderman, 2000] and PhotoFinder Kuchinsky et al., 1999]).

The authors’ proposal is that of exploiting the timestamps at which the pictures have been taken. They propose an organizational, and visual, clustering of the pictures which divide the photos using longer periods of inactivities between one picture and the next.

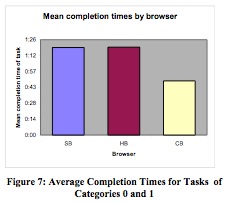
To verify their assumption, the authors tested the PhotoBrowser against other two applications. The first was a Hierarchical Browser, which organized the pictures at different levels corresponding to time at different granularity. The Scrollable Browser, organized the pictures into a single time-ordered list that could be scrolled.

The author asked 12 subjects to perform 6 retrieval tasks following different criteria. Their main result was that the browser that organized the pictures into temporal clusters enabled significantly faster completion times at an average of about 50 seconds.

Graham_PhotoBrowsing_completion-times.jpg

Multimodal and Mobile Personal Image Retrieval: A User Study

These last months, I have been collaborating to a research project on Multimodal Information Retrieval of digital pictures collected through camera phones. Recently, one of the papers resuming the results of the research was presented at the International Workshop of Mobile Information Retrieval, held in conjunction with SIGIR in Singapore. Here goes the abstract and the URL to download the paper.

X. Anguera, N. Oliver, and M. Cherubini. Multimodal and mobile personal image retrieval: A user study. In K. L. Chan, editor, Prooceeding of the International Workshop on Mobile Information Retrieval (MobIR’08), pages 17–23, Singapore, 20-24 July 2008. [PDF]

Mobile phones have become multimedia devices. Therefore it is not uncommon to observe users capturing photos and videos on their mobile phones. As the amount of digital multimedia content expands, it becomes increasingly difficult to find specific images in the device. In this paper, we present our experience with MAMI, a mobile phone prototype that allows users to annotate and search for digital photos on their camera phone via speech input. MAMI is implemented as a mobile application that runs in real-time on the phone. Users can add speech annotations at the time of capturing photos or at a later time. Additional metadata is also stored with the photos, such as location, user identification, date and time of capture and image-based features. Users can search for photos in their personal repository by means of speech without the need of connectivity to a server. In this paper, we focus on our findings from a user study aimed at comparing the efficacy of the search and the ease-of-use and desirability of the MAMI prototype when compared to the standard image browser available on mobile phones today.