Last Wednesday I participated to this workshop organized by Nicolas Nova and William Cockayne. The idea was to brainstorm for two hours using critical foresight techniques. But, what is critical foresight? The way Bill presented it, is an effort to brainstorm in a structured manner thinking about the long-term future.
Future is complex and ambiguous. The only way it is possible to say something about the future is by analyzing the past using analytical reasoning and understand when change happened. The point is then to project the same patterns found for a certain story ahead in the future so to find possibilities. Quoting Nicolas:
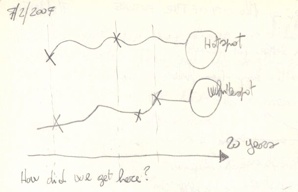
This is one of the crux element we have to tackle while doing critical foresight: unfolding the history backward from and end point to now, by describing what happened in the forms of changes/events. The lines here can be seen as a metaphor of two different histories that unfold.
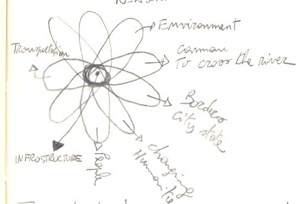
William presented a couple of techniques that can be used in these circumstances: the petal graph, is a diagram where you map each critical aspect of change that you can list while thinking to a certain theme. The goals is then to find the commonalities of all these aspect, what goes in the center of the flower.
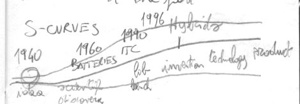
Another graph that we used was called the S-curve. It’s an s-shaped curve that has at the beginning the date a certain idea was invented and at the end of the curve the date where the corresponding technology finally reached mass market. In between all the different inventions and technologies that contributed to the raise of the curve. The goal is to understand what critical invention / moment constituted the turning point of the curve and made the realization of the idea possible.
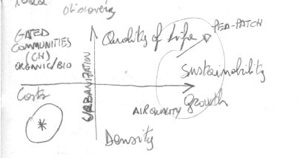
The last graph was a cartesian diagram where four different aspect of a certain theme needs to be opposed. Once the axes have been defined the brainstorm aims at finding stories and position these stories in the quadrants according to their match to the 4 defined dimensions. High-density spots are called hot-spots and the contrary are called white-spots. Both are extremely interesting for critical foresight.
One defined these two areas we can then used a diachronic table to answer the question: how did we get here? The table, in fact, should map the most important momentums in the definition of a certain technology with the goal of projecting the line to touch the hot spots or the white spots. The time-scale of the graph is usually 20 years.
Foresight thinking for design encompasses three mayor steps:
(1) Observation: -think about people today; -if they change what is the reason?; -what are the early indicators (triggers)?
(2) Analyzing and describing: -ideas are fine; -questions are important; -assumptions are critical; -stories will tie it all together.
(3) Prototyping: -models are endpoints; -the models generate questions around the areas of interest; -the underlying assumptions and questions are more important.
The results of the workshop are less interesting than the methodology that we used to produce them.
Here is also a list of readings and movies that can inform more and inspire for critical foresight.
